At this point you have setup the Elasticsearch stack along with a Windows host in which you are collecting logs using Winlogbeat. Now it’s time to start visualizing and searching logs real-time!
Step 1 – Create an Index using Kibana
Navigate to http://analyze:5601 or http://ELK:5601 depending on which tutorial you’ve followed.
Select Management and click on “Index Patterns”
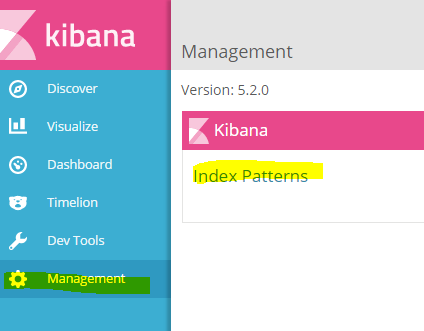
You will come across a page which will ask you to create a pattern:
If you are indeed receiving data, you should be able to type the name of your index.
My example: logstash-winlogbeat* (make sure you add the * asterisk).
Select the drop-down under Time-field name and select “@timestamp” and finally hit Create.
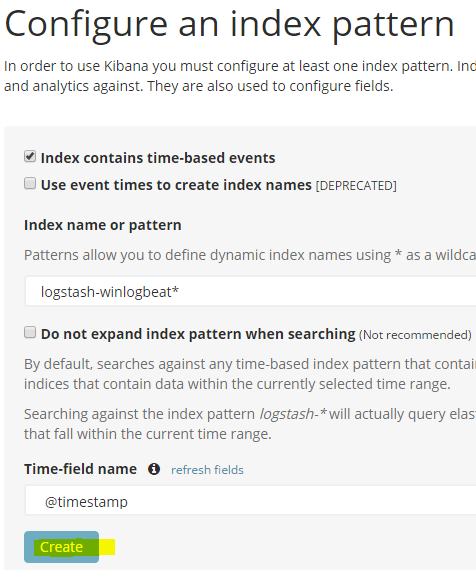
Your index should be created now. You may go back to “Discover” and see your data come in.
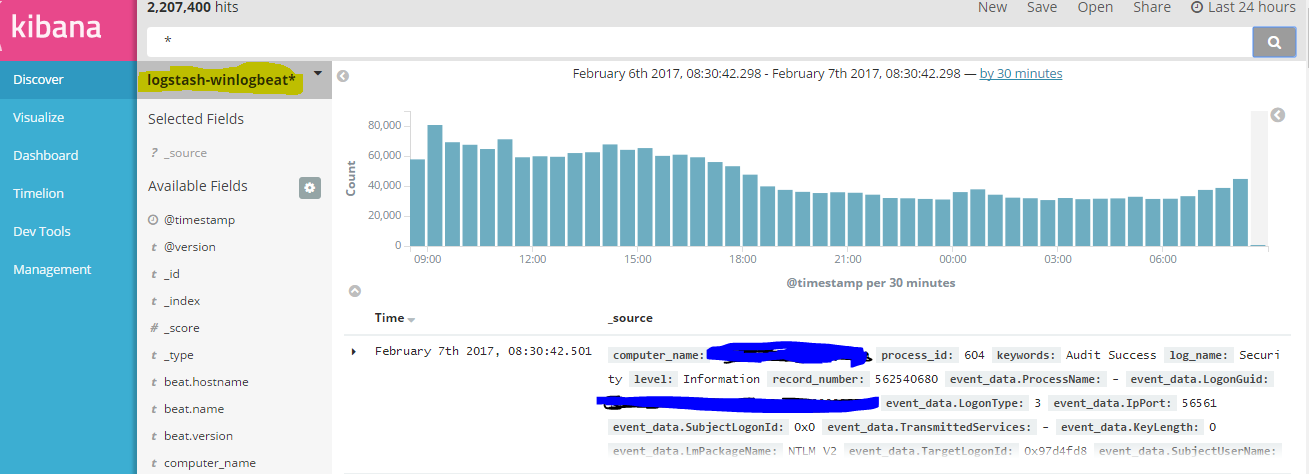
You may search your data in various ways and create meaningful visualizations please visit the Kibana page for a quick tutorial.
Additionally, as you start receiving records, your fields will increase as new logs are generated that do not exist on your index. Occasionally you may want to go back to to Management > Index Pattern > select your index and hit the refresh Icon to refresh your fields.
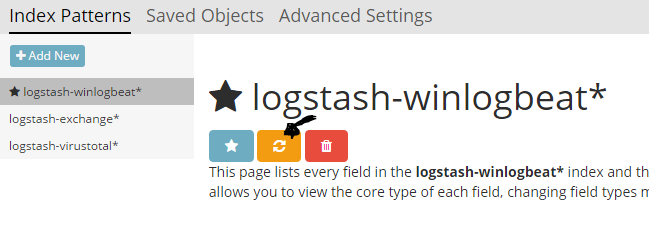
Get familiar with the fields and the data expected, so you may then create meaningful visualizations.
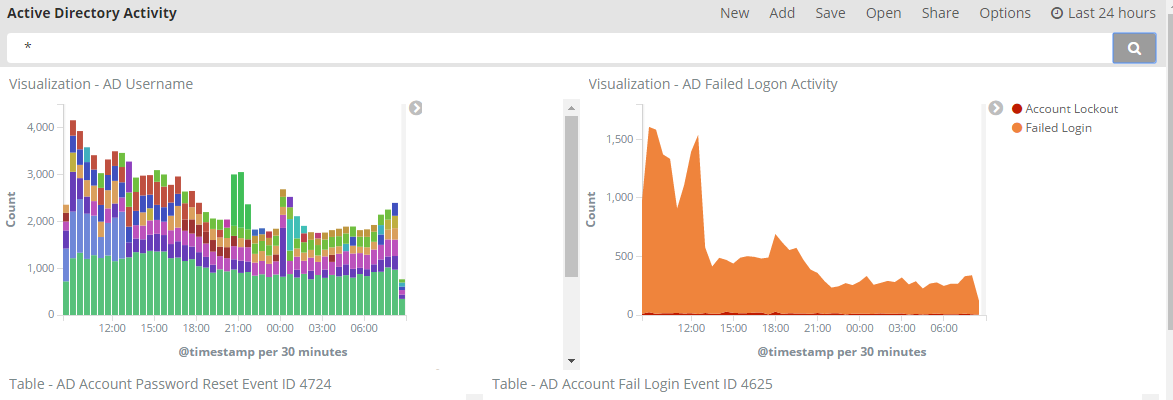
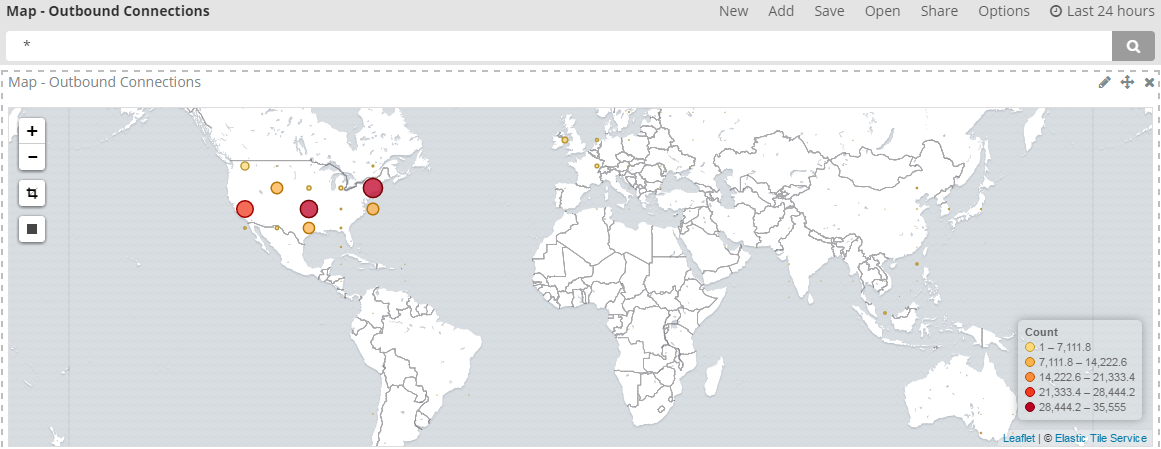
Here’s some of my Dashboards:
Active Directory Logins Activity
Remote desktop sessions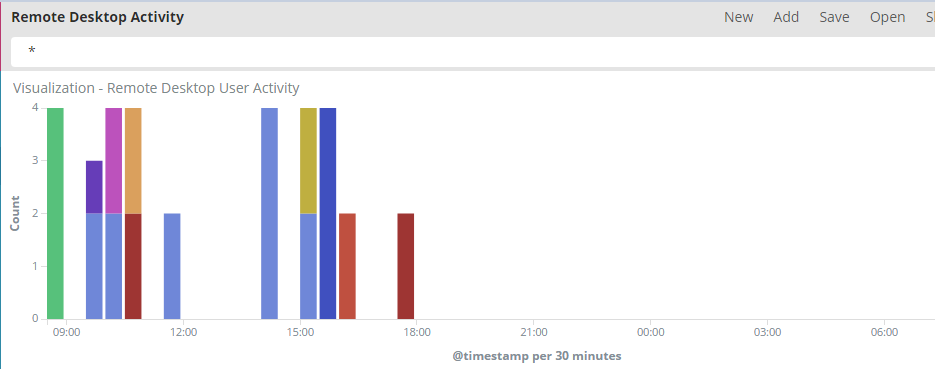
Outbound connections Map (Geo_Ip)
[…] http://www.syspanda.com/index.php/2017/02/07/setting-up-elasticsearch-5-x-monitoring-and-visualizing… […]